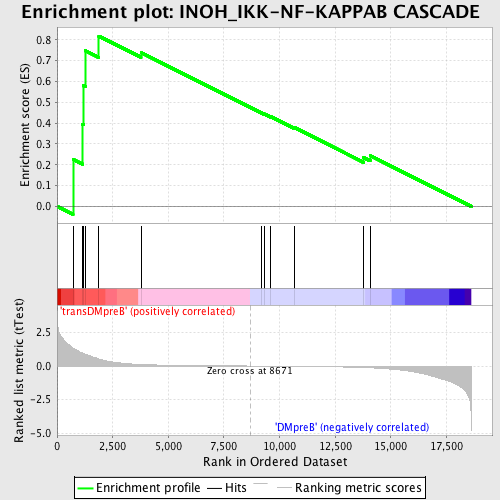
Profile of the Running ES Score & Positions of GeneSet Members on the Rank Ordered List
| Dataset | Set_04_transDMpreB_versus_DMpreB.phenotype_transDMpreB_versus_DMpreB.cls #transDMpreB_versus_DMpreB.phenotype_transDMpreB_versus_DMpreB.cls #transDMpreB_versus_DMpreB_repos |
| Phenotype | phenotype_transDMpreB_versus_DMpreB.cls#transDMpreB_versus_DMpreB_repos |
| Upregulated in class | transDMpreB |
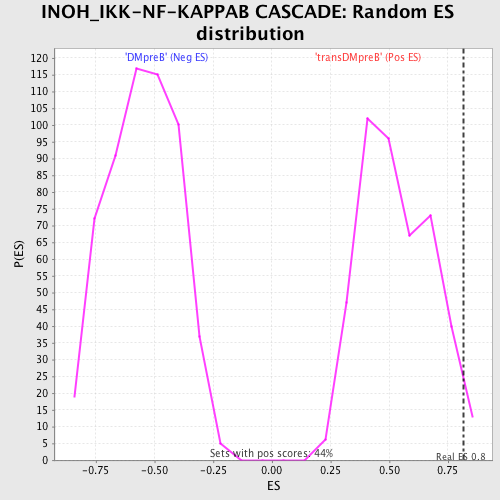
| GeneSet | INOH_IKK-NF-KAPPAB CASCADE |
| Enrichment Score (ES) | 0.8178517 |
| Normalized Enrichment Score (NES) | 1.5429708 |
| Nominal p-value | 0.022522522 |
| FDR q-value | 0.34302786 |
| FWER p-Value | 0.99 |
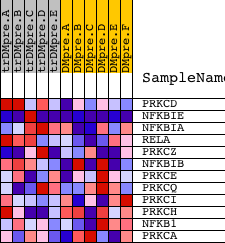
| PROBE | DESCRIPTION (from dataset) | GENE SYMBOL | GENE_TITLE | RANK IN GENE LIST | RANK METRIC SCORE | RUNNING ES | CORE ENRICHMENT | |
|---|---|---|---|---|---|---|---|---|
| 1 | PRKCD | 21897 | 716 | 1.338 | 0.2256 | Yes | ||
| 2 | NFKBIE | 23225 1556 | 1147 | 0.973 | 0.3945 | Yes | ||
| 3 | NFKBIA | 21065 | 1178 | 0.947 | 0.5799 | Yes | ||
| 4 | RELA | 23783 | 1277 | 0.876 | 0.7475 | Yes | ||
| 5 | PRKCZ | 5260 | 1877 | 0.520 | 0.8179 | Yes | ||
| 6 | NFKBIB | 17906 | 3771 | 0.117 | 0.7391 | No | ||
| 7 | PRKCE | 9575 | 9170 | -0.006 | 0.4501 | No | ||
| 8 | PRKCQ | 2873 2831 | 9311 | -0.008 | 0.4442 | No | ||
| 9 | PRKCI | 9576 | 9605 | -0.012 | 0.4307 | No | ||
| 10 | PRKCH | 21246 | 10685 | -0.026 | 0.3779 | No | ||
| 11 | NFKB1 | 15160 | 13771 | -0.113 | 0.2344 | No | ||
| 12 | PRKCA | 20174 | 14071 | -0.131 | 0.2443 | No |